Motivating Myself to Design Every Day With Gamification
January 08, 2026
Read on Medium →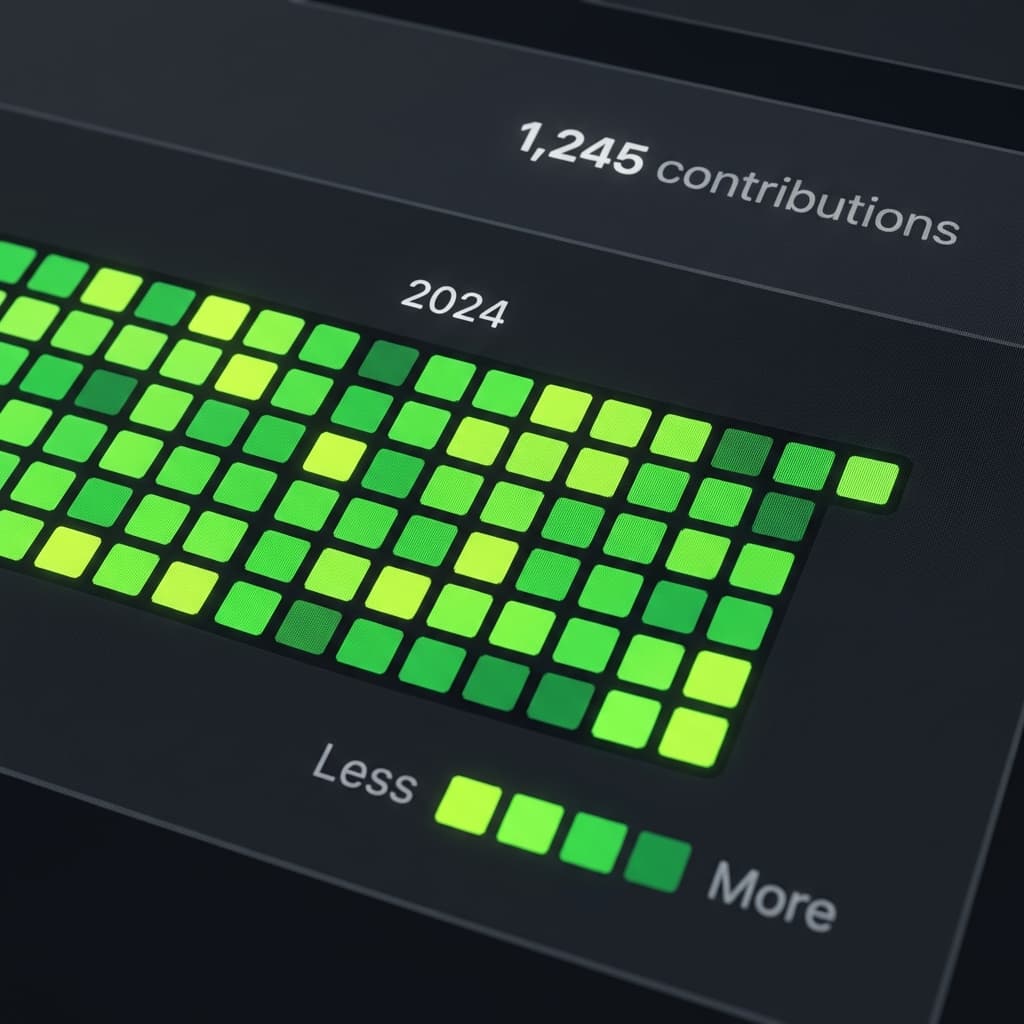
I have previously run several gamification experiments, ranging from encouraging better saving habits to increasing engagement on tech news platforms. Through this work, I became convinced that gamification is a powerful behavioral tool. When applied thoughtfully, it taps into cognitive patterns that motivate users to take consistent action.
This led me to a simple question: could the same principles be applied to doing design work itself?
I began by studying widely used gamification techniques such as quests, streaks, incentives, competition, and badges. I also analyzed products that implement these ideas effectively, including Duolingo and the Apple Watch.
One pattern stood out immediately. Streaks are already deeply embedded in developer culture. GitHub's contribution graph is a strong example of streaks done right. It is a universally recognizable and pre-learned visual model for people in tech, with a clear signal of consistency and progress.
That familiarity made streaks an ideal mechanic to adapt for design work.
GitHub Contributions is a visual record of activity over the past year, displayed as a grid where each square represents a single day. The color intensity of each square reflects the level of activity, with darker squares indicating busier days and lighter ones showing lower activity. This simple visualization effectively communicates consistency and momentum at a glance.
That model felt like a natural fit for gamifying my own design work. Beyond personal tracking, it could also provide project managers with a quick, high-level view of output trends over time.
From a design standpoint, accessibility was critical. If this lived anywhere other than my phone, I knew I would not consistently check it. An iOS widget was the obvious choice. It allows the data to stay visible without friction, reinforcing the habit through passive awareness.
The interface itself could remain intentionally minimal. GitHub has already refined this pattern extremely well, so rather than reinventing it, I adapted its core visual language to fit a design-focused context.
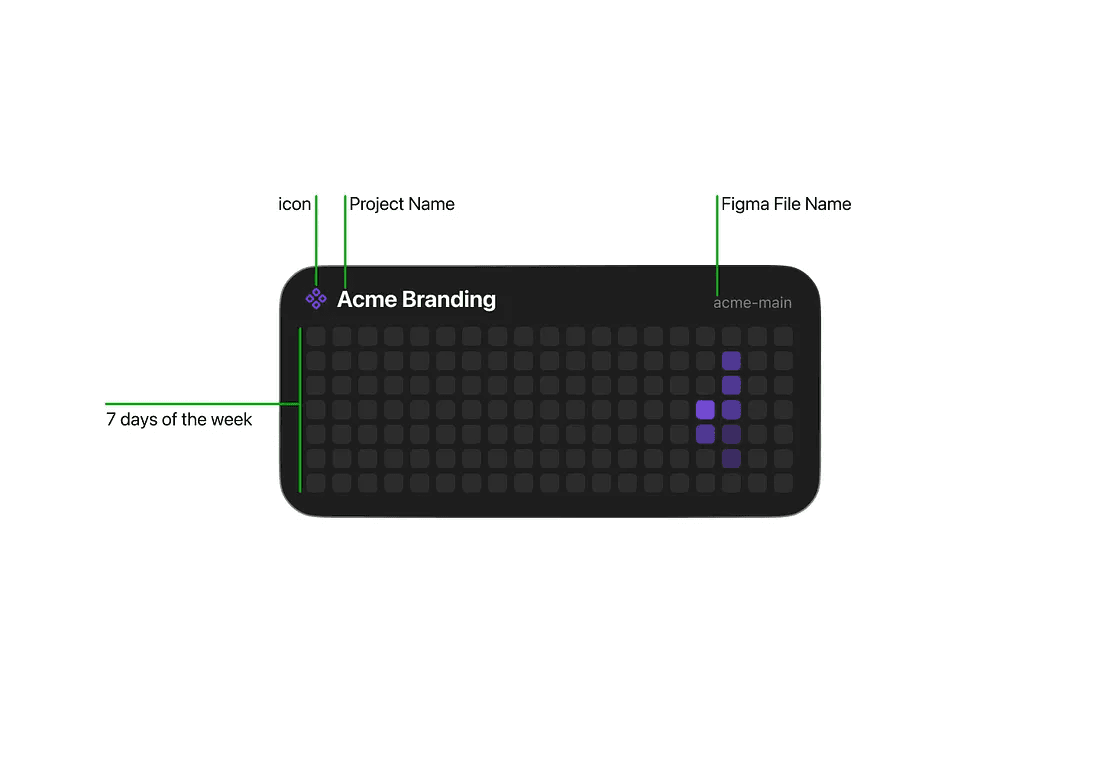
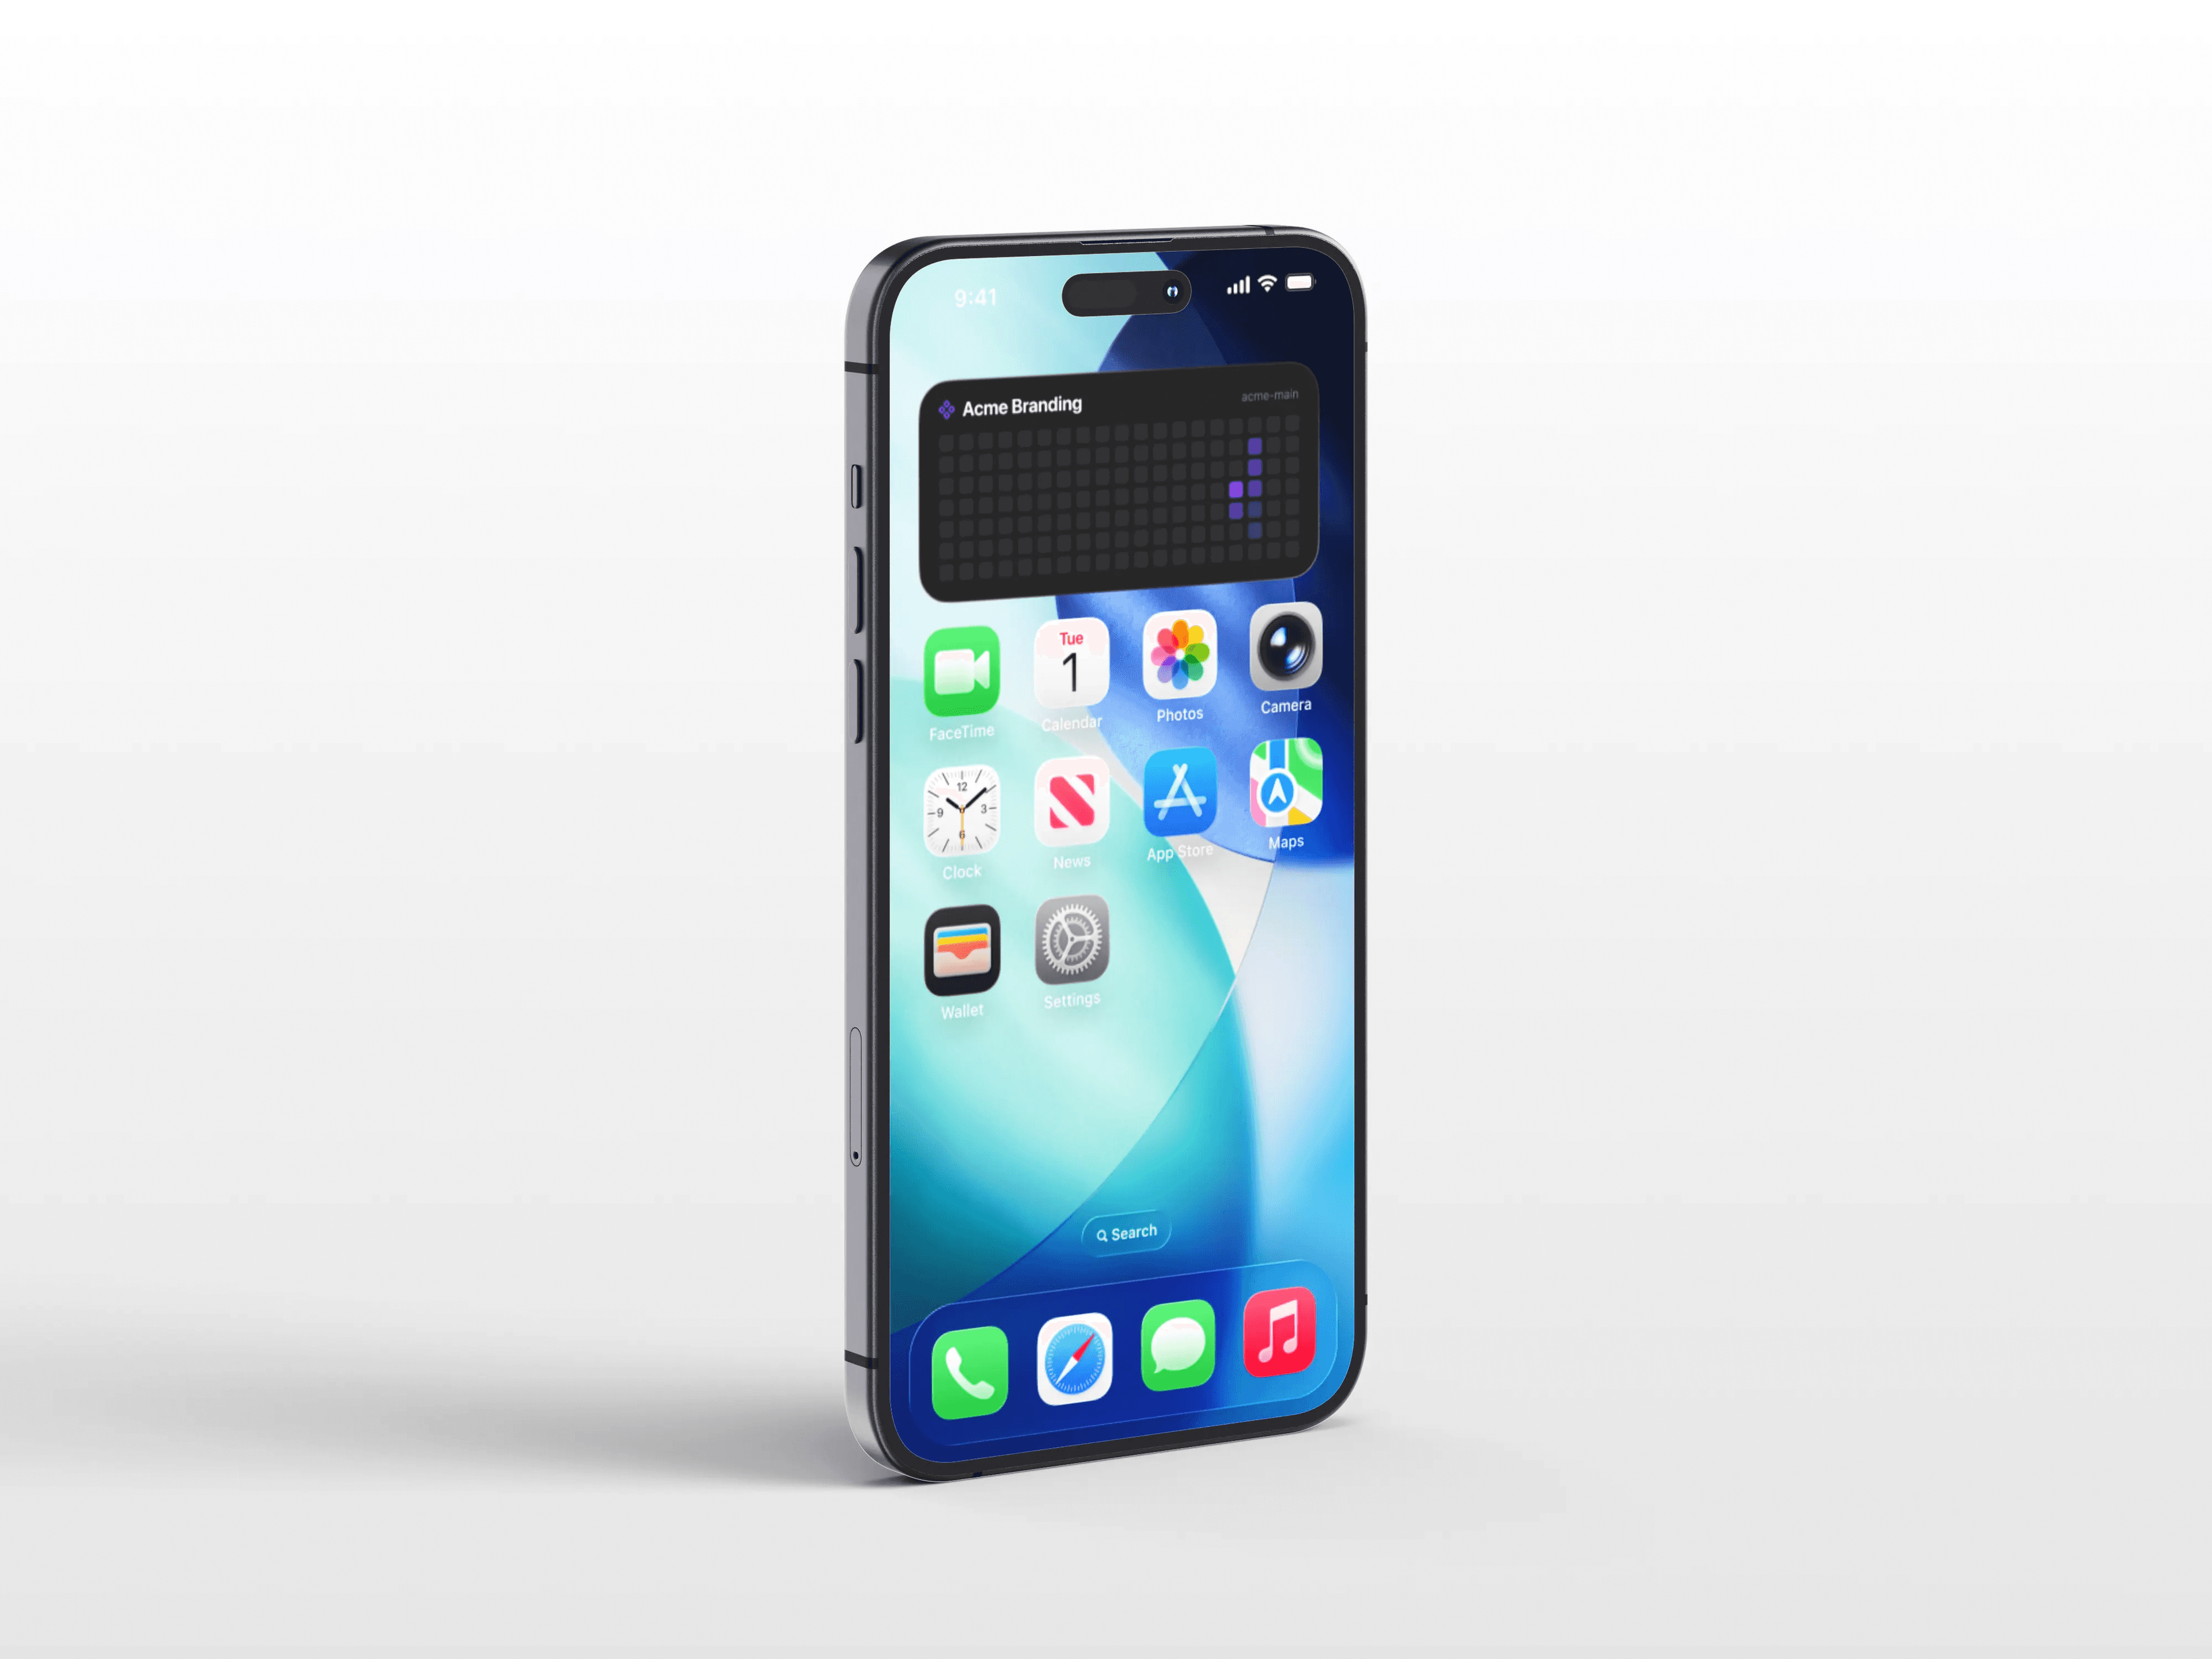
I built the widget using Scriptable, an iOS app that lets users create custom widgets directly on their device using JavaScript. The setup is straightforward: you provide an API token and the file key for the specific file you want to track, and the script handles the rest.
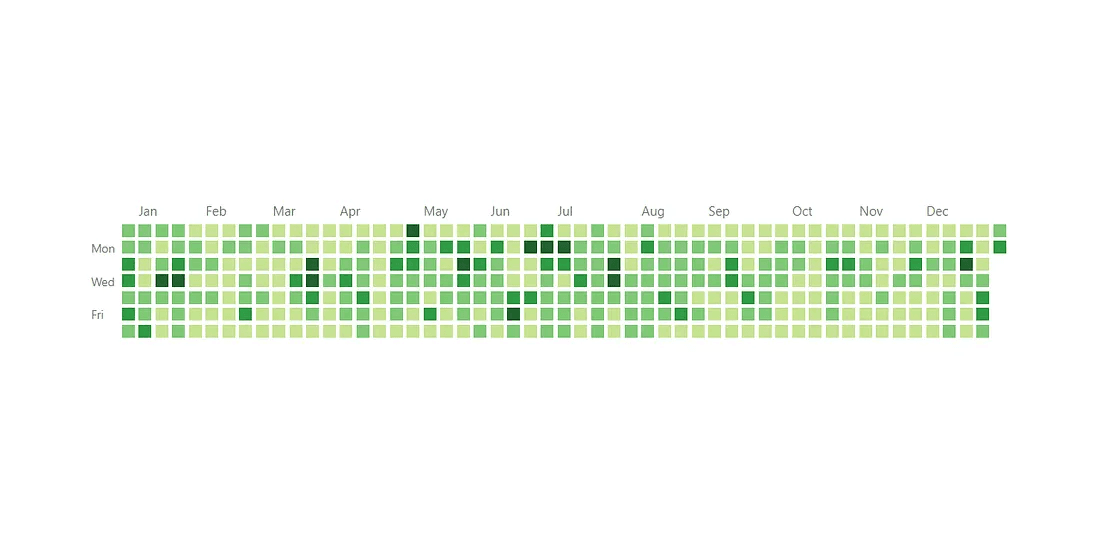
The widget displays seven rows, one for each day of the week. The opacity of each day adjusts based on the amount of activity recorded, making patterns of consistency and effort immediately visible at a glance.
You can experiment with the code yourself to explore different visual treatments or interaction ideas and iterate on the concept further.
// ==========================================
// CONFIGURATION
// ==========================================

// 1. Figma Personal Access Token
// Generate here: https://www.figma.com/developers/api#access-tokens

// Begins with 'figd'
const FIGMA_TOKEN = " ";

// 2. File Key
// Found in url: figma.com/file/THIS_IS_THE_KEY/Project-Name
const FILE_KEY = "";

// 3. Widget Settings
const WEEKS_TO_SHOW = 20;
const BLOCK_SIZE = 16;
const BLOCK_GAP = 4;
const PADDING = 16;

// 4. Color Theme (Figma Purple Style)
const THEME = {
  bg: new Color("#1e1e1e"), // Dark Gray
  text: new Color("#ffffff"),
  // Heatmap Levels (Darker -> Brighter Purple)
  levels: [
    new Color("#2c2c2c"), // 0 (Inactive)
    new Color("#7c4dff", 0.3), // 1
    new Color("#7c4dff", 0.5), // 2
    new Color("#7c4dff", 0.8, // 3
    new Color("#00dff0")       // 4 (Cyan for high activity)
  ]
};

// ==========================================
// MAIN LOGIC
// ==========================================

if (config.runsInWidget) {
  const widget = await createWidget();
  Script.setWidget(widget);
} else {
  const widget = await createWidget();
  await widget.presentMedium();
}
Script.complete();

async function createWidget() {
  const w = new ListWidget();
  w.backgroundColor = THEME.bg;
  w.setPadding(PADDING, PADDING, PADDING, PADDING);

  // 1. Fetch Data
  const fileData = await fetchFigmaFile();
  const versionsData = await fetchFigmaVersions();

  if (!fileData || !versionsData) {
    const err = w.addText("Error fetching Figma data. Check Token/ID.");
    err.textColor = Color.red();
    return w;
  }

  // 2. Header
  const headStack = w.addStack();
  headStack.centerAlignContent();

  // Figma Logo (SF Symbol approximation)
  const icon = headStack.addImage(SFSymbol.named("paintbrush.pointed.fill").image);
  icon.imageSize = new Size(14, 14);
  icon.tintColor = new Color("#7c4dff"); // Cyan accent

  headStack.addSpacer(6);

  const title = headStack.addText("Project Name");
  title.font = Font.boldSystemFont(14);
  title.textColor = THEME.text;
  title.lineLimit = 1;

  headStack.addSpacer();

  const dateText = headStack.addText("File Name");
  dateText.font = Font.systemFont(10);
  dateText.textColor = Color.gray();

  w.addSpacer();

  // 3. Draw Heatmap
  const gridImage = drawHeatmap(versionsData);
  const imgWidget = w.addImage(gridImage);
  imgWidget.centerAlignImage();
  imgWidget.applyFittingContentMode();

  w.url = https://www.figma.com/file/${FILE_KEY};
  return w;
}

// ==========================================
// DRAWING LOGIC
// ==========================================

function drawHeatmap(versions) {
  // 1. Process Data: Group versions by Date (YYYY-MM-DD)
  const counts = {};
  versions.forEach(v => {
    // API returns ISO string "2023-10-25T..."
    const dateStr = v.created_at.split('T')[0];
    counts[dateStr] = (counts[dateStr] || 0) + 1;
  });

  // 2. Canvas Setup
  const colFullWidth = BLOCK_SIZE + BLOCK_GAP;
  const widthNeeded = (WEEKS_TO_SHOW * colFullWidth) - BLOCK_GAP;
  const heightNeeded = (7 * colFullWidth) - BLOCK_GAP;

  const ctx = new DrawContext();
  ctx.size = new Size(widthNeeded, heightNeeded);
  ctx.opaque = false;
  ctx.respectScreenScale = true;

  // 3. Grid Calculation
  const today = new Date();
  const dayOfWeek = today.getDay(); // 0 (Sun)
  const currentWeekSunday = new Date(today);
  currentWeekSunday.setDate(today.getDate() - dayOfWeek);

  // Iterate Columns (Weeks)
  for (let col = 0; col < WEEKS_TO_SHOW; col++) {
    const weeksAgo = (WEEKS_TO_SHOW - 1) - col;
    const colSunday = new Date(currentWeekSunday);
    colSunday.setDate(currentWeekSunday.getDate() - (weeksAgo * 7));

    // Iterate Rows (Days)
    for (let row = 0; row < 7; row++) {
      const cellDate = new Date(colSunday);
      cellDate.setDate(colSunday.getDate() + row);

      if (cellDate > today) continue;

      const dateStr = cellDate.toISOString().split('T')[0];
      const count = counts[dateStr] || 0;

      // Draw Block
      const x = col * colFullWidth;
      const y = row * colFullWidth;
      const rect = new Rect(x, y, BLOCK_SIZE, BLOCK_SIZE);
      const path = new Path();
      path.addRoundedRect(rect, 4, 4);

      ctx.setFillColor(getColor(count));
      ctx.addPath(path);
      ctx.fillPath();
    }
  }

  return ctx.getImage();
}

function getColor(count) {
  if (count === 0) return THEME.levels[0];
  if (count <= 2) return THEME.levels[1];
  if (count <= 5) return THEME.levels[2];
  if (count <= 10) return THEME.levels[3];
  return THEME.levels[4];
}

// ==========================================
// API CALLS
// ==========================================

async function fetchFigma(endpoint) {
  const req = new Request(https://api.figma.com/v1${endpoint});
  req.headers = { "X-Figma-Token": FIGMA_TOKEN };
  try {
    return await req.loadJSON();
  } catch (e) {
    console.error(e);
    return null;
  }
}

async function fetchFigmaFile() {
  return await fetchFigma(/files/${FILE_KEY});
}

async function fetchFigmaVersions() {
  // Fetches version history.
  // Note: Figma API pagination might be needed for very old history,
  // but the default page usually covers the recent weeks needed for the widget.
  const res = await fetchFigma(/files/${FILE_KEY}/versions);
  return res ? res.versions : null;
}
Admittedly I vibecoded everything with Gemini, and it saved me the headache of having to scrub through Scriptable documentation for days.
If you liked the widget and used it, make sure to hit me up! You can contact me @ namansubedi.com/contact